44 亚组分析及森林图绘制
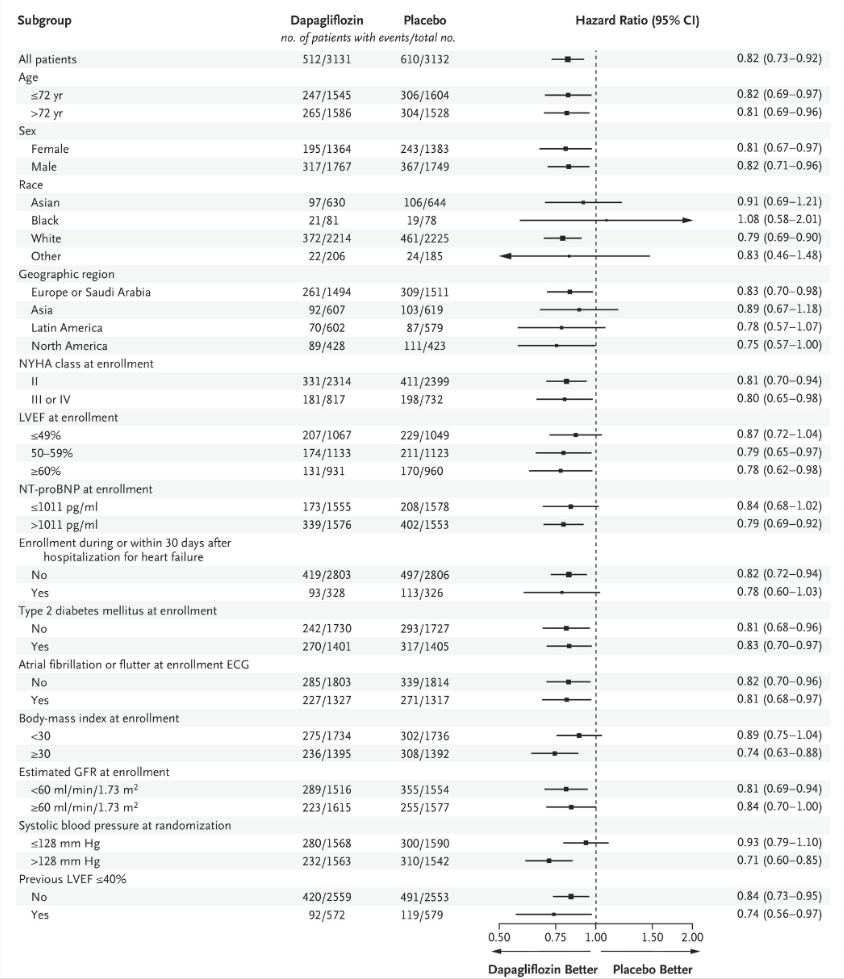
亚组分析的森林图很常见,在各种高分SCI文章中经常见到,其中我最喜欢NEJM的格式,美观,信息量也多。
亚组分析的森林图我们也介绍过很多方法了,其中forestploter画出来的森林图还是最美观的,使用起来也不复杂。
相关推文:
但是咱们之前只是说了有了数据怎么画图,并没有介绍过怎么实现亚组分析,也有好多粉丝在群里问这个问题,所以下面给大家展示下如何实现COX回归分析的亚组分析,其他回归分析也是同理。
并根据结果实现如下样式的森林图:DOI: 10.1056/NEJMoa2206286
44.1 准备数据
使用survival包中的colon数据集用于演示,这是一份关于结肠癌患者的生存数据,共有1858行,16列,共分为3个组,1个观察组+2个治疗组,观察他们发生终点事件的差异。
各变量的解释如下:
- id:患者id
- study:没啥用,所有患者都是1
- rx:治疗方法,共3种,Obs(观察组), Lev(左旋咪唑), Lev+5FU(左旋咪唑+5-FU)
- sex:性别,1是男性
- age:年龄
- obstruct:肠梗阻,1是有
- perfor:肠穿孔,1是有
- adhere:和附近器官粘连,1是有
- nodes:转移的淋巴结数量
- status:生存状态,0代表删失,1代表发生终点事件
- differ:肿瘤分化程度,1-well,2-moderate,3-poor
- extent:局部扩散情况,1-submucosa,2-muscle,3-serosa,4-contiguous structures
- surg:手术后多久了,1-long,2-short
- node4:是否有超过4个阳性淋巴结,1代表是
- time:生存时间
- etype:终点事件类型,1-复发,2-死亡
rm(list = ls())
library(survival)

str(colon)
## 'data.frame':    1858 obs. of  16 variables:
##  $ id      : num  1 1 2 2 3 3 4 4 5 5 ...
##  $ study   : num  1 1 1 1 1 1 1 1 1 1 ...
##  $ rx      : Factor w/ 3 levels "Obs","Lev","Lev+5FU": 3 3 3 3 1 1 3 3 1 1 ...
##  $ sex     : num  1 1 1 1 0 0 0 0 1 1 ...
##  $ age     : num  43 43 63 63 71 71 66 66 69 69 ...
##  $ obstruct: num  0 0 0 0 0 0 1 1 0 0 ...
##  $ perfor  : num  0 0 0 0 0 0 0 0 0 0 ...
##  $ adhere  : num  0 0 0 0 1 1 0 0 0 0 ...
##  $ nodes   : num  5 5 1 1 7 7 6 6 22 22 ...
##  $ status  : num  1 1 0 0 1 1 1 1 1 1 ...
##  $ differ  : num  2 2 2 2 2 2 2 2 2 2 ...
##  $ extent  : num  3 3 3 3 2 2 3 3 3 3 ...
##  $ surg    : num  0 0 0 0 0 0 1 1 1 1 ...
##  $ node4   : num  1 1 0 0 1 1 1 1 1 1 ...
##  $ time    : num  1521 968 3087 3087 963 ...
##  $ etype   : num  2 1 2 1 2 1 2 1 2 1 ...
可以使用cox回归探索危险因素。分类变量需要变为因子型,这样在进行回归时会自动进行哑变量设置。
为了演示,我们只选择Obs组和Lev+5FU组的患者,所有的分类变量都变为factor,把年龄也变为分类变量并变成factor。
suppressMessages(library(tidyverse))

df <- colon %>%
  mutate(rx=as.numeric(rx)) %>%
  filter(etype == 1, !rx == 2) %>%  #rx %in% c("Obs","Lev+5FU"),
  select(time, status,rx, sex, age,obstruct,perfor,adhere,differ,extent,surg,node4) %>%
  mutate(sex=factor(sex, levels=c(0,1),labels=c("female","male")),
         age=ifelse(age >65,">65","<=65"),
         age=factor(age, levels=c(">65","<=65")),
         obstruct=factor(obstruct, levels=c(0,1),labels=c("No","Yes")),
         perfor=factor(perfor, levels=c(0,1),labels=c("No","Yes")),
         adhere=factor(adhere, levels=c(0,1),labels=c("No","Yes")),
         differ=factor(differ, levels=c(1,2,3),labels=c("well","moderate","poor")),
         extent=factor(extent, levels=c(1,2,3,4),
                       labels=c("submucosa","muscle","serosa","contiguous")),
         surg=factor(surg, levels=c(0,1),labels=c("short","long")),
         node4=factor(node4, levels=c(0,1),labels=c("No","Yes")),
         rx=ifelse(rx==3,0,1),
         rx=factor(rx,levels=c(0,1))
         )

str(df)
## 'data.frame':    619 obs. of  12 variables:
##  $ time    : num  968 3087 542 245 523 ...
##  $ status  : num  1 0 1 1 1 1 0 0 0 1 ...
##  $ rx      : Factor w/ 2 levels "0","1": 1 1 2 1 2 1 2 1 1 2 ...
##  $ sex     : Factor w/ 2 levels "female","male": 2 2 1 1 2 1 2 1 2 2 ...
##  $ age     : Factor w/ 2 levels ">65","<=65": 2 2 1 1 1 2 2 1 2 2 ...
##  $ obstruct: Factor w/ 2 levels "No","Yes": 1 1 1 2 1 1 1 1 1 1 ...
##  $ perfor  : Factor w/ 2 levels "No","Yes": 1 1 1 1 1 1 1 1 1 1 ...
##  $ adhere  : Factor w/ 2 levels "No","Yes": 1 1 2 1 1 1 1 1 1 1 ...
##  $ differ  : Factor w/ 3 levels "well","moderate",..: 2 2 2 2 2 2 2 2 3 2 ...
##  $ extent  : Factor w/ 4 levels "submucosa","muscle",..: 3 3 2 3 3 3 3 3 3 3 ...
##  $ surg    : Factor w/ 2 levels "short","long": 1 1 1 2 2 1 1 2 2 1 ...
##  $ node4   : Factor w/ 2 levels "No","Yes": 2 1 2 2 2 2 1 1 1 1 ...
44.2 不分亚组的分析
直接使用所有数据,拟合单因素Cox回归模型:
fit <- coxph(Surv(time, status) ~ rx, data = df)
broom::tidy(fit,exponentiate = T,conf.int = T)
## # A tibble: 1 × 7
##   term  estimate std.error statistic   p.value conf.low conf.high
##   <chr>    <dbl>     <dbl>     <dbl>     <dbl>    <dbl>     <dbl>
## 1 rx1       1.67     0.119      4.32 0.0000156     1.32      2.11
这个结果我们在之前说过无数遍了,各项意义就不做具体解释了。
通过这个结果可以看出,Lev+5FU组是明显好于Obs组的,那么问题来了。
有一个著名的东西叫辛普森悖论,这个方法对所有人有效,但是把这个方法单独对男人或女人使用,就没效了!
这就是由于性别这个混杂因素导致的,控制混杂因素的方法,我们在医学统计系列推文中说过至少3种,今天就给大家演示最好理解的亚组分析。
思路其实很简单,单独在男性患者中拟合模型看看结果是不是和所有患者的结果一样;然后单独在女性患者中也拟合模型。
对于其他的分类变量,都是一样的操作。
所以我说这个方法最简单,没有什么高深的数学理论,只是操作起来比较复杂,因为需要在每个分类变量的每个亚组中分别拟合模型。
刚开始我是想通过嵌套for循环实现的,但是有点费脑子,所以我给大家演示下tidyverse的做法,后期会考虑再写个R包,实现这个功能。
其实我已经找到了一个R包Publish可以实现回归分析的亚组分析,但是它的方法是错误的。。。
通常最笨的方法也是最靠谱的方法,如果你实在不会,也可以手动实现这个过程,就以sex为例,先在male中拟合模型:
fit0 <- coxph(Surv(time, status) ~ rx, data = df[df$sex == "male",])
broom::tidy(fit0,exponentiate = T,conf.int = T)
## # A tibble: 1 × 7
##   term  estimate std.error statistic    p.value conf.low conf.high
##   <chr>    <dbl>     <dbl>     <dbl>      <dbl>    <dbl>     <dbl>
## 1 rx1       2.29     0.181      4.57 0.00000495     1.60      3.26
然后在female中拟合模型:
fit0 <- coxph(Surv(time, status) ~ rx, data = df[df$sex == "female",])
broom::tidy(fit0,exponentiate = T,conf.int = T)
## # A tibble: 1 × 7
##   term  estimate std.error statistic p.value conf.low conf.high
##   <chr>    <dbl>     <dbl>     <dbl>   <dbl>    <dbl>     <dbl>
## 1 rx1       1.32     0.161      1.71  0.0878    0.960      1.80
就这样不断的重复即可,然后把数据手动摘录一下。
44.3 亚组分析
对于先分组,再做某事这种分析思路,tidyverse天生就比较擅长。
以下是tidyverse实现方法,借助purrr。
首先把数据变为长数据,经典的长宽转换:
dfl <- df %>%
  pivot_longer(cols = 4:ncol(.),names_to = "var",values_to = "value") %>%
  arrange(var)

head(dfl)
## # A tibble: 6 × 5
##    time status rx    var    value
##   <dbl>  <dbl> <fct> <chr>  <fct>
## 1   968      1 0     adhere No
## 2  3087      0 0     adhere No
## 3   542      1 1     adhere Yes
## 4   245      1 0     adhere No
## 5   523      1 1     adhere No
## 6 904 1 0 adhere No根据rx(治疗方式)和var(需要分亚组的变量)分组,分别在每个组内拟合cox回归,并提取结果,一气呵成,这个操作我们在之前的倾向性评分分层中也演示过:倾向性评分回归和分层
ress <- dfl %>%
  #group_by(var,value) %>%
  group_nest(var,value) %>%
  drop_na(value) %>%
  mutate(#sample_size=map(data, ~ nrow(.x)),
         model=map(data, ~ coxph(Surv(time, status) ~ rx,data = .x)),
         res = map(model, broom::tidy,conf.int = T, exponentiate = T)
         ) %>%
  dplyr::select(var,value,res)
## Warning: There was 1 warning in `mutate()`.
## ℹ In argument: `model = map(data, ~coxph(Surv(time, status) ~ rx, data = .x))`.
## Caused by warning in `coxph.fit()`:
## ! Loglik converged before variable  1 ; coefficient may be infinite.

glimpse(ress)
## Rows: 21
## Columns: 3
## $ var   <chr> "adhere", "adhere", "age", "age", "differ", "differ", "differ", …
## $ value <fct> No, Yes, >65, <=65, well, moderate, poor, submucosa, muscle, ser…
## $ res <list> [<tbl_df[1 x 7]>], [<tbl_df[1 x 7]>], [<tbl_df[1 x 7]>], [<tbl_…res是列表列,其中每个元素就是我们的结果。
顺便把每个亚组中每种治疗方式的人数也一起计算出来:
ss <- dfl %>%
  group_by(var,value,rx) %>%
  drop_na(value) %>%
  summarise(sample_size=n()) %>%
  dplyr::select(var,value,rx,sample_size)
然后把两个结果合并到一起:
resss <- ress %>%
  left_join(ss,b=c("var","value")) %>%
  unnest(res,rx,sample_size) %>%
  pivot_wider(names_from = "rx",values_from = "sample_size",names_prefix = "rx_") %>%
  select(-c(term,std.error,statistic)) %>%
  mutate(across(where(is.numeric), round,digits=2)) %>%
  mutate(`HR(95%CI)`=paste0(estimate,"(",conf.low,"-",conf.high,")"))
## Warning: `unnest()` has a new interface. See `?unnest` for details.
## ℹ Try `df %>% unnest(c(res, rx, sample_size))`, with `mutate()` if needed.
## Warning: There was 1 warning in `mutate()`.
## ℹ In argument: `across(where(is.numeric), round, digits = 2)`.
## Caused by warning:
## ! The `...` argument of `across()` is deprecated as of dplyr 1.1.0.
## Supply arguments directly to `.fns` through an anonymous function instead.
##
##   # Previously
##   across(a:b, mean, na.rm = TRUE)
##
##   # Now
##   across(a:b, \(x) mean(x, na.rm = TRUE))

str(resss)
## tibble [21 × 9] (S3: tbl_df/tbl/data.frame)
##  $ var      : chr [1:21] "adhere" "adhere" "age" "age" ...
##  $ value    : Factor w/ 15 levels "female","male",..: 5 6 3 4 7 8 9 10 11 12 ...
##  $ estimate : num [1:21] 1.69 1.5 1.97 1.52 2.68 1.67 1.32 0 2.41 1.68 ...
##  $ p.value  : num [1:21] 0 0.17 0 0 0.02 0 0.28 1 0.07 0 ...
##  $ conf.low : num [1:21] 1.31 0.84 1.33 1.14 1.19 1.26 0.8 0 0.93 1.31 ...
##  $ conf.high: num [1:21] 2.18 2.67 2.93 2.03 6.02 ...
##  $ rx_0     : num [1:21] 265 39 114 190 29 215 54 10 32 251 ...
##  $ rx_1     : num [1:21] 268 47 110 205 27 229 52 8 38 249 ...
##  $ HR(95%CI): chr [1:21] "1.69(1.31-2.18)" "1.5(0.84-2.67)" "1.97(1.33-2.93)" "1.52(1.14-2.03)" ...

head(resss)
## # A tibble: 6 × 9
##   var    value    estimate p.value conf.low conf.high  rx_0  rx_1 `HR(95%CI)`
##   <chr>  <fct>       <dbl>   <dbl>    <dbl>     <dbl> <dbl> <dbl> <chr>
## 1 adhere No           1.69    0        1.31      2.18   265   268 1.69(1.31-2.1…
## 2 adhere Yes          1.5     0.17     0.84      2.67    39    47 1.5(0.84-2.67)
## 3 age    >65          1.97    0        1.33      2.93   114   110 1.97(1.33-2.9…
## 4 age    <=65         1.52    0        1.14      2.03   190   205 1.52(1.14-2.0…
## 5 differ well         2.68    0.02     1.19      6.02    29    27 2.68(1.19-6.0…
## 6 differ moderate     1.67    0        1.26      2.21   215   229 1.67(1.26-2.2…
这样亚组分析就做好了,HR,可信区间,P值,每个组的人数都有了,还记得前面做的整体的结果吗,我们把它合并进来,方便后面画森林图用。
fit <- coxph(Surv(time, status) ~ rx, data = df)
res_all <- broom::tidy(fit,exponentiate = T,conf.int = T)

#看下不同治疗组的人数
df %>% count(rx)
##   rx   n
## 1  0 304
## 2  1 315

res_all <- res_all %>%
  mutate(var="All people",
         value=" ",
         rx_0=304,
         rx_1=305,
         across(where(is.numeric), round,digits=2)
         ) %>%
  mutate(`HR(95%CI)`=paste0(estimate,"(",conf.low,"-",conf.high,")")
         ) %>%
  select(var,value,estimate,p.value,conf.low,conf.high,rx_0,rx_1,`HR(95%CI)`)

res_all
## # A tibble: 1 × 9
##   var        value estimate p.value conf.low conf.high  rx_0  rx_1 `HR(95%CI)`
##   <chr>      <chr>    <dbl>   <dbl>    <dbl>     <dbl> <dbl> <dbl> <chr>
## 1 All people " "       1.67       0     1.32      2.11   304   305 1.67(1.32-2.…
合并到一起:
resss <- bind_rows(res_all,resss)
head(resss)
## # A tibble: 6 × 9
##   var        value  estimate p.value conf.low conf.high  rx_0  rx_1 `HR(95%CI)`
##   <chr>      <chr>     <dbl>   <dbl>    <dbl>     <dbl> <dbl> <dbl> <chr>
## 1 All people " "        1.67    0        1.32      2.11   304   305 1.67(1.32-2…
## 2 adhere     "No"       1.69    0        1.31      2.18   265   268 1.69(1.31-2…
## 3 adhere     "Yes"      1.5     0.17     0.84      2.67    39    47 1.5(0.84-2.…
## 4 age        ">65"      1.97    0        1.33      2.93   114   110 1.97(1.33-2…
## 5 age        "<=65"     1.52    0        1.14      2.03   190   205 1.52(1.14-2…
## 6 differ     "well"     2.68    0.02     1.19      6.02    29    27 2.68(1.19-6…
到这里所有数据就都准备好了!下面只要整理下格式,画图即可。
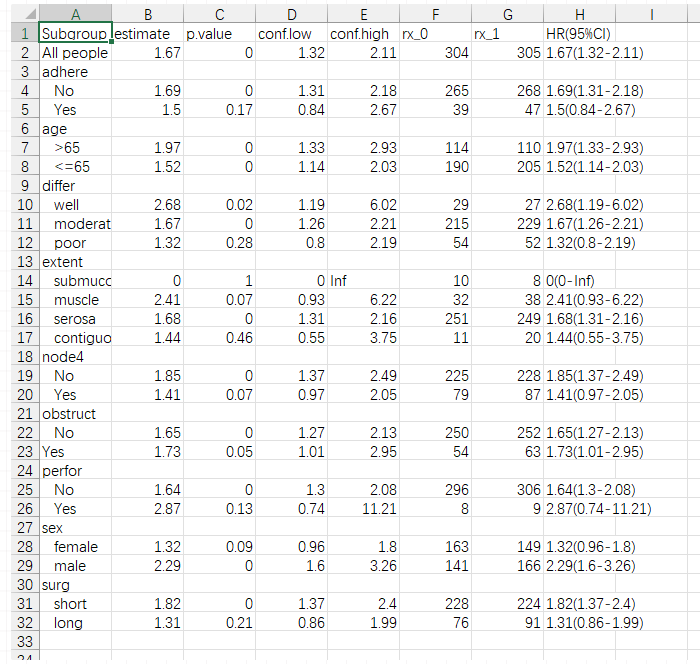
但是forestploter包画森林图的格式还是蛮复杂的,所以我们直接另存为csv,用excel修改好,再读进来。
write.csv(resss, file = "resss.csv",quote = F,row.names = T)44.4 画森林图
把数据整理成这样:

还有一些细节你可以自己修改下,比如各个亚组的顺序,首字母大写,各个变体的大小写,分组变量的名字,把P值为0的改成<0.0001,等。我就不改了
然后读取进来:
plot_df <- read.csv(file = "datasets/resss.csv",check.names = F)
plot_df
##         Subgroup estimate p.value conf.low conf.high rx_0 rx_1        HR(95%CI)
## 1     All people     1.67    0.00     1.32      2.11  304  305  1.67(1.32-2.11)
## 2         adhere       NA      NA       NA        NA   NA   NA
## 3             No     1.69    0.00     1.31      2.18  265  268  1.69(1.31-2.18)
## 4            Yes     1.50    0.17     0.84      2.67   39   47   1.5(0.84-2.67)
## 5            age       NA      NA       NA        NA   NA   NA
## 6            >65     1.97    0.00     1.33      2.93  114  110  1.97(1.33-2.93)
## 7           <=65     1.52    0.00     1.14      2.03  190  205  1.52(1.14-2.03)
## 8         differ       NA      NA       NA        NA   NA   NA
## 9           well     2.68    0.02     1.19      6.02   29   27  2.68(1.19-6.02)
## 10      moderate     1.67    0.00     1.26      2.21  215  229  1.67(1.26-2.21)
## 11          poor     1.32    0.28     0.80      2.19   54   52   1.32(0.8-2.19)
## 12        extent       NA      NA       NA        NA   NA   NA
## 13     submucosa     0.00    1.00     0.00       Inf   10    8         0(0-Inf)
## 14        muscle     2.41    0.07     0.93      6.22   32   38  2.41(0.93-6.22)
## 15        serosa     1.68    0.00     1.31      2.16  251  249  1.68(1.31-2.16)
## 16    contiguous     1.44    0.46     0.55      3.75   11   20  1.44(0.55-3.75)
## 17         node4       NA      NA       NA        NA   NA   NA
## 18            No     1.85    0.00     1.37      2.49  225  228  1.85(1.37-2.49)
## 19           Yes     1.41    0.07     0.97      2.05   79   87  1.41(0.97-2.05)
## 20      obstruct       NA      NA       NA        NA   NA   NA
## 21            No     1.65    0.00     1.27      2.13  250  252  1.65(1.27-2.13)
## 22           Yes     1.73    0.05     1.01      2.95   54   63  1.73(1.01-2.95)
## 23        perfor       NA      NA       NA        NA   NA   NA
## 24            No     1.64    0.00     1.30      2.08  296  306   1.64(1.3-2.08)
## 25           Yes     2.87    0.13     0.74     11.21    8    9 2.87(0.74-11.21)
## 26           sex       NA      NA       NA        NA   NA   NA
## 27        female     1.32    0.09     0.96      1.80  163  149   1.32(0.96-1.8)
## 28          male     2.29    0.00     1.60      3.26  141  166   2.29(1.6-3.26)
## 29          surg       NA      NA       NA        NA   NA   NA
## 30         short     1.82    0.00     1.37      2.40  228  224   1.82(1.37-2.4)
## 31 long 1.31 0.21 0.86 1.99 76 91 1.31(0.86-1.99)把数据中的说明部分的NA变成空格,这样画森林图时就不会显示了,然后增加1列空值用于展示可信区间:
plot_df[,c(3,6,7)][is.na(plot_df[,c(3,6,7)])] <- " "
plot_df$` ` <- paste(rep(" ", nrow(plot_df)), collapse = " ")
plot_df
##         Subgroup estimate p.value conf.low conf.high rx_0 rx_1        HR(95%CI)
## 1     All people     1.67       0     1.32      2.11  304  305  1.67(1.32-2.11)
## 2         adhere       NA               NA        NA
## 3             No     1.69       0     1.31      2.18  265  268  1.69(1.31-2.18)
## 4            Yes     1.50    0.17     0.84      2.67   39   47   1.5(0.84-2.67)
## 5            age       NA               NA        NA
## 6            >65     1.97       0     1.33      2.93  114  110  1.97(1.33-2.93)
## 7           <=65     1.52       0     1.14      2.03  190  205  1.52(1.14-2.03)
## 8         differ       NA               NA        NA
## 9           well     2.68    0.02     1.19      6.02   29   27  2.68(1.19-6.02)
## 10      moderate     1.67       0     1.26      2.21  215  229  1.67(1.26-2.21)
## 11          poor     1.32    0.28     0.80      2.19   54   52   1.32(0.8-2.19)
## 12        extent       NA               NA        NA
## 13     submucosa     0.00       1     0.00       Inf   10    8         0(0-Inf)
## 14        muscle     2.41    0.07     0.93      6.22   32   38  2.41(0.93-6.22)
## 15        serosa     1.68       0     1.31      2.16  251  249  1.68(1.31-2.16)
## 16    contiguous     1.44    0.46     0.55      3.75   11   20  1.44(0.55-3.75)
## 17         node4       NA               NA        NA
## 18            No     1.85       0     1.37      2.49  225  228  1.85(1.37-2.49)
## 19           Yes     1.41    0.07     0.97      2.05   79   87  1.41(0.97-2.05)
## 20      obstruct       NA               NA        NA
## 21            No     1.65       0     1.27      2.13  250  252  1.65(1.27-2.13)
## 22           Yes     1.73    0.05     1.01      2.95   54   63  1.73(1.01-2.95)
## 23        perfor       NA               NA        NA
## 24            No     1.64       0     1.30      2.08  296  306   1.64(1.3-2.08)
## 25           Yes     2.87    0.13     0.74     11.21    8    9 2.87(0.74-11.21)
## 26           sex       NA               NA        NA
## 27        female     1.32    0.09     0.96      1.80  163  149   1.32(0.96-1.8)
## 28          male     2.29       0     1.60      3.26  141  166   2.29(1.6-3.26)
## 29          surg       NA               NA        NA
## 30         short     1.82       0     1.37      2.40  228  224   1.82(1.37-2.4)
## 31          long     1.31    0.21     0.86      1.99   76   91  1.31(0.86-1.99)
##
## 1
## 2
## 3
## 4
## 5
## 6
## 7
## 8
## 9
## 10
## 11
## 12
## 13
## 14
## 15
## 16
## 17
## 18
## 19
## 20
## 21
## 22
## 23
## 24
## 25
## 26
## 27
## 28
## 29
## 30
## 31
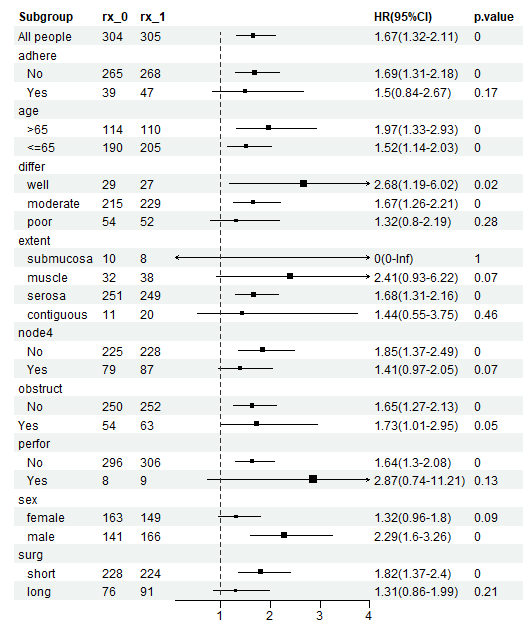
然后画图即可,默认的出图就已经很美观了,但是大家要注意,这里每个组的人数和开头那张图的每个组的人数稍有不同哦~
library(forestploter)
library(grid)

p <- forest(
  data = plot_df[,c(1,6,7,9,8,3)],
  lower = plot_df$conf.low,
  upper = plot_df$conf.high,
  est = plot_df$estimate,
  ci_column = 4,
  sizes = (plot_df$estimate+0.001)*0.3,
  ref_line = 1,
  xlim = c(0.1,4)
  )
print(p)
如果你还需要美化,我们在之前也详细介绍过这个包的使用细节了:
下面是我们美化后的森林图,其实变化不是非常大,只要数据好,默认的图形也很好看:

和开头那张NEJM的风格一模一样!
pdf("aaa.pdf",width = 8,height = 10)
tm <- forest_theme(base_size = 12, # 基础大小
                   # 可信区间点的形状,线型、颜色、宽度
                   #ci_lty = 1,
                   ci_lwd = 1.5,
                   #ci_Theight = 0.2, # 可信区间两端加短竖线
                   # 参考线宽度、形状、颜色
                   refline_lwd = 1.5,
                   refline_lty = "dashed",
                   refline_col = "grey20",
                   # 汇总菱形的填充色和边框色
                   #summary_fill = "#4575b4",
                   #summary_col = "#4575b4",
                   # 脚注大小、字体、颜色
                   footnote_cex = 0.8,
                   footnote_fontface = "italic",
                   footnote_col = "grey30",
                   # 自定义背景色、前景色。fontface:1常规,2粗体,3斜体,4粗斜体
                   core = list(bg_params = list(fill = c("#FFFFFF","#f5f7f6"), col=NA))
                   )

p <- forest(
  data = plot_df[,c(1,6,7,9,8,3)],
  lower = plot_df$conf.low,
  upper = plot_df$conf.high,
  est = plot_df$estimate,
  ci_column = 4,
  sizes = (plot_df$estimate+0.001)*0.3, # 不能是负值或NA,而且不能太大
  ref_line = 1, # 把竖线放到1的位置
  xlim = c(0.1,4), # x轴范围,如果有的可信区间超过这个范围会显示为箭头
  arrow_lab = c("Obs better","Lev+5-FU better"), # x轴下面的文字
  theme = tm
  )
print(p)
dev.off()
44.5 其他资源
亚组分析和森林图的内容还有非常多的细节问题,为了不影响该合集的主要内容,我把它们放在下面的链接中,大家感兴趣的话可点击下面的链接查看,或者在公众号后台回复亚组分析获取合集链接: