rm(list = ls())
lowbirth <- read.csv("./datasets/lowbirth.csv")7 逻辑回归列线图绘制
首先给大家介绍逻辑回归的列线图绘制,下面给大家介绍2种方法,我在之前还介绍过其他方法,但是有些方法(R包)已经太久不更新了,文献中用的也不多,这里就不介绍了。
我两年前写的推文:Logistic回归列线图的4种绘制方法,虽然方法没错,但是很多细节有问题,所以这里重新整理下。
7.1 准备数据
使用lowbirth数据集,这个数据集是关于低出生体重儿是否会死亡的数据集,共有565行,10列。其中dead这一列是结果变量,0代表存活,1代表死亡,其余列都是预测变量。
获取lowbirth数据请在公众号:医学和生信笔记,后台回复20220520。或者到粉丝QQ群文件自取。
查看一下数据:
dim(lowbirth) # 565行,10列
## [1] 565  10
str(lowbirth)
## 'data.frame':    565 obs. of  10 variables:
##  $ birth   : num  81.5 81.6 81.6 81.6 81.6 ...
##  $ lowph   : num  7.25 7.06 7.25 6.97 7.32 ...
##  $ pltct   : int  244 114 182 54 282 153 229 182 361 378 ...
##  $ race    : chr  "white" "black" "black" "black" ...
##  $ bwt     : int  1370 620 1480 925 1255 1350 1310 1110 1180 970 ...
##  $ delivery: chr  "abdominal" "vaginal" "vaginal" "abdominal" ...
##  $ apg1    : int  7 1 8 5 9 4 6 6 6 2 ...
##  $ vent    : int  0 1 0 1 0 0 1 0 0 1 ...
##  $ sex     : chr  "female" "female" "male" "female" ...
## $ dead : int 0 1 0 1 0 0 0 0 0 1 ...数据中有很多分类变量,比如race、delivery、sex、vent,但是类型是chr或者int,通常在R语言中需要把分类变量变成factor,也就是因子型。
除此之外,race这个变量一共有4个类别:其中oriental和native American这两个类别太少了,这样在建立模型的时候会导致不可靠的结果,所以我们需要对这个变量进行一些转换。
table(lowbirth$race)
##
##           black native American        oriental           white
## 325 14 4 222还有就是,有些模型(比如逻辑回归)要求分类变量先进行哑变量(或者其他方法)转换,但是你如果把分类变量变成了因子型,R语言内部会自动帮你转换,不需要手动进行,相关知识我详细介绍过,可以参考分类变量进行回归分析时的编码方案
对于分类型的因变量,通常需要也变成factor类型,虽然很多R包支持不同类型,但是我建议你转换。
下面就是用代码实现两步预处理:
- 分类变量(包括因变量)因子化
- 把
oriental和native American这两个类别合并成一个类别,就叫other
library(dplyr)

tmp <- lowbirth %>%
  mutate(across(where(is.character),as.factor),
         vent = factor(vent),
         dead = factor(dead),
         race = case_when(race %in%
                            c("native American","oriental") ~ "other",
                          .default = race),
         race = factor(race))

str(tmp)
## 'data.frame':    565 obs. of  10 variables:
##  $ birth   : num  81.5 81.6 81.6 81.6 81.6 ...
##  $ lowph   : num  7.25 7.06 7.25 6.97 7.32 ...
##  $ pltct   : int  244 114 182 54 282 153 229 182 361 378 ...
##  $ race    : Factor w/ 3 levels "black","other",..: 3 1 1 1 1 1 3 1 3 3 ...
##  $ bwt     : int  1370 620 1480 925 1255 1350 1310 1110 1180 970 ...
##  $ delivery: Factor w/ 2 levels "abdominal","vaginal": 1 2 2 1 2 1 2 2 1 2 ...
##  $ apg1    : int  7 1 8 5 9 4 6 6 6 2 ...
##  $ vent    : Factor w/ 2 levels "0","1": 1 2 1 2 1 1 2 1 1 2 ...
##  $ sex     : Factor w/ 2 levels "female","male": 1 1 2 1 1 1 2 2 2 1 ...
##  $ dead    : Factor w/ 2 levels "0","1": 1 2 1 2 1 1 1 1 1 2 ...
7.2 方法1:rms
这个R包非常强大,以后在很多场景中都会用到,是目前唯一能胜任临床预测模型所有步骤的R包。
library(rms)首先是打包数据,这一步对于rms包来说是必须的:
dd <- datadist(tmp)
options(datadist="dd")
构建逻辑回归模型,我们只使用其中的部分变量进行演示:
fit1 <- lrm(dead==1 ~ birth + lowph + pltct + bwt + vent + race,
            data = tmp)
#fit1上面使用了dead==1表示要计算死亡的概率,这里指定一下不容易出错。
lrm()做逻辑回归应该是默认计算排序靠后的类别的概率。
接下来就是构建列线图,然后画图。
nom1 <- nomogram(fit1, fun=plogis,
                 fun.at=c(0.001,0.1,0.25,0.5,0.75,0.9,0.99),
                 lp=T, # 是否显示线性预测值
                 maxscale = 100, # 最大得分数
                 conf.int = F, # 添加置信区间,很难看,可以不要
                 funlabel="Risk of Death")
plot(nom1) 
还可以进行一些美化,这个函数的参数非常多,大家可以通过帮助文档自己学习:
plot(nom1,
     col.grid=c("tomato","grey")
     #conf.space = c(0.3,0.5) # 置信区间位置
) 
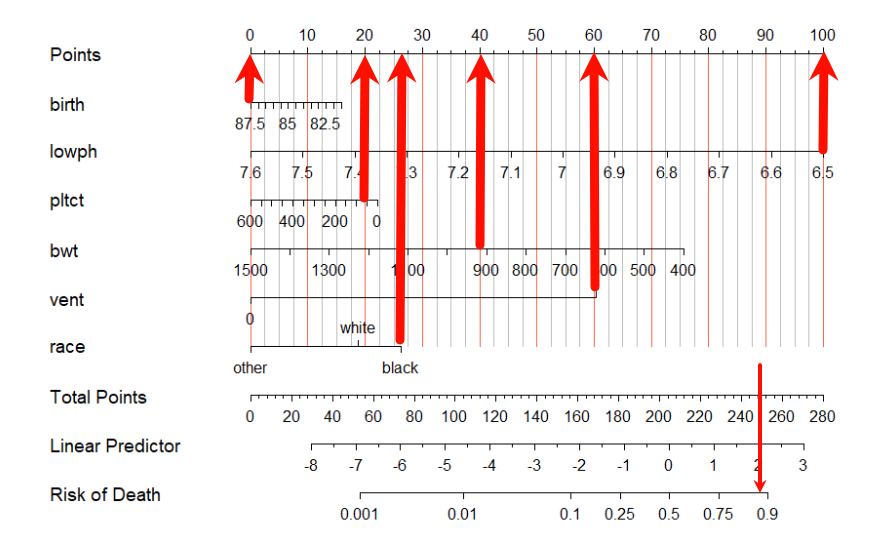
这个图形展示的是不同变量的取值对应的得分情况,最上面一行是每个变量对应的得分。
假如有一个患者:
- 他的
birth是87.5,那么对应得分就是0分(看下面的示意图); - 他的
lowph是6.5,那么对应的得分是100; - 他的
pltct是50,那么对应的得分是20分; - 他的
bwt是920(大约),那么对应的得分是40; - 他的
vent是1,那么对应的得分是60; - 他的
race是black,那么对应的得分是27(大约)

这样一来你就可以得到这个患者的总得分是:100+20+40+60+27=247,这样你就可以在Total Points这一行找到247,然后对应线性预测值(Linear Predictor)就是2,对应的死亡风险是0.85(大约)。
列线图就是这么看的,不管有多么的花里胡哨都是这么看的,没有任何区别。
实际在计算每个患者得分时有专门的R包实现,不用自己算,后面的章节会介绍。
下面给大家展示下“先做哑变量处理再画列线图”是什么样的效果。就以race这个变量为例。
tmp0 <- lowbirth %>%
  mutate(across(where(is.character),as.factor),
         vent = factor(vent),
         dead = factor(dead),
         # 下面是对race做哑变量处理
         black = ifelse(race == "black",1,0),
         white = ifelse(race == "white",1,0),
         other = ifelse(race %in% c("native American","oriental"),1,0)
         ) %>%
  select(- race)

# race一列变3列了,这个哑变量怎么看,请参考
# [分类变量进行回归分析时的编码方案]
str(tmp0)
## 'data.frame':    565 obs. of  12 variables:
##  $ birth   : num  81.5 81.6 81.6 81.6 81.6 ...
##  $ lowph   : num  7.25 7.06 7.25 6.97 7.32 ...
##  $ pltct   : int  244 114 182 54 282 153 229 182 361 378 ...
##  $ bwt     : int  1370 620 1480 925 1255 1350 1310 1110 1180 970 ...
##  $ delivery: Factor w/ 2 levels "abdominal","vaginal": 1 2 2 1 2 1 2 2 1 2 ...
##  $ apg1    : int  7 1 8 5 9 4 6 6 6 2 ...
##  $ vent    : Factor w/ 2 levels "0","1": 1 2 1 2 1 1 2 1 1 2 ...
##  $ sex     : Factor w/ 2 levels "female","male": 1 1 2 1 1 1 2 2 2 1 ...
##  $ dead    : Factor w/ 2 levels "0","1": 1 2 1 2 1 1 1 1 1 2 ...
##  $ black   : num  0 1 1 1 1 1 0 1 0 0 ...
##  $ white   : num  1 0 0 0 0 0 1 0 1 1 ...
##  $ other   : num  0 0 0 0 0 0 0 0 0 0 ...

dd <- datadist(tmp0)
options(datadist="dd")
# 以other这个类别为参考
fit0 <- lrm(dead==1 ~ birth+lowph+pltct+bwt+vent+black+white,data = tmp0)
nom0 <- nomogram(fit0, fun=plogis,
                 fun.at=c(0.001,0.1,0.25,0.5,0.75,0.9,0.99),
                 funlabel="Risk of Death")
plot(nom0,col.grid=c("tomato","grey")) 
看到不同了吗?black和white是两列,other是参考,所以不用写在公式里,当black和white都是0的时候就表示other,当black是1的时候就表示black,white和other此时必为0(不信你可以查看tmp0这个数据),white为1的时候就表示white,此时black和other比为0。
但是你再仔细观察,你会发现这个图里的black和white对应的分数和上面的列线图是一样的,神奇吗?所以你不需要先自己进行哑变量处理(R会自动处理),虽然画出来的图不一样,但是得分、概率啥的都是一样的,就只是图不一样而已。
7.3 方法2:regplot
这个R包也非常强大,也是做临床预测模型必须要学习的包。
library(regplot)

# 建立模型,这里使用glm也可以
fit2 <- lrm(dead==1 ~ birth + lowph + pltct + bwt + vent + race,
            data = tmp)

# 绘图
aa <- regplot(fit2,
        #连续性变量形状,"no plot""density""boxes""ecdf"
        #"bars""boxplot""violin""bean" "spikes";
        #分类变量的形状,可选"no plot" "boxes" "bars" "spikes"
        plots = c("violin", "boxes"),
        observation = tmp[1,], #用哪行观测,或者T F
        center = T, # 对齐变量
        subticks = T,
        droplines = T,#是否画竖线
        title = "nomogram",
        points = T, # 截距项显示为0-100
        odds = T, # 是否显示OR值
        showP = T, # 是否显示变量的显著性标记
        rank = "sd", # 根据sd给变量排序
        interval="confidence", # 展示可信区间
        clickable = F # 是否可以交互
        )
这个图看起来更加的花里胡哨,但是图的解读还是和上面一样的,而且我们还有代码专门展示了第一个患者的得分情况。
唯一不同就是在图中添加了各种图形用来展示各个变量的数据分布情况。
仔细看你会发现,同样的数据同样的模型和变量,但是画出来的列线图细节确有很多地方不一样!都是正确的哈,写文章时把R包的参考文献加进去即可,别纠结。
除了以上两种方法外,之前还有另外两个R包可以使用:VRPM和DynNom,但是这两个包太老了,很久没更新了,所以目前只能通过下载安装包本地安装。目前不推荐使用了,如果你一定要用,可参考:Logistic回归列线图的4种绘制方法