rm(list = ls())
load(file = "./datasets/timeROC.RData")22 生存数据ROC曲线绘制
不管是生存数据还是分类数据,绘制ROC曲线的原理都是一样的(详见第一章)。对于生存分析来说,由于它加入了时间因素,所以我们在绘制ROC曲线时,需要指定一个具体的时间点,在这个具体的时间点上,我们可以计算具体的生存状态以及对应的对应的概率,也就是可以把生存问题转换为二分类问题,这样才能绘制ROC曲线。
生存资料的ROC曲线绘制,最常见的那肯定是timeROC和survivalROC了,这两个包非常像,我比较喜欢用timeROC。
22.1 加载数据
22.2 多个时间点ROC
计算生存数据的ROC曲线以及AUC值,需要3列数据:生存时间,生存状态,以及你的分类依据(也就是你根据什么把样本分成生存还是死亡),在具体执行时,还必须指定时间点。
看一下画图所需的数据长什么样子,event这一列是生存状态,0代表living,1代表dead,futime这一列是生存时间,单位是年,riskScore这一列是分类依据。
str(df)
## 'data.frame':    297 obs. of  3 variables:
##  $ event    : num  0 0 1 0 0 1 0 0 0 0 ...
##  $ riskScore: num  -0.249 -0.511 -0.211 -0.427 0.279 ...
##  $ futime   : num  3.03 1.16 1.82 1.52 1.34 ...
head(df)
##   event    riskScore   futime
## 1     0 -0.249325687 3.027500
## 2     0 -0.511105679 1.155833
## 3     1 -0.211305578 1.819167
## 4     0 -0.427056800 1.516667
## 5     0  0.278585747 1.344167
## 7 1 -0.006760815 0.050000下面我们使用timeROC包中的timeROC()函数计算不同时间点的AUC值。
# 加载R包
library(timeROC)
library(survival)

# 构建timeroc
ROC <- timeROC(T=df$futime,
               delta=df$event,
               marker=df$riskScore,
               cause=1,                #阳性结局指标数值
               weighting="marginal",   #计算方法,默认为marginal
               times=c(1, 2, 3),       #时间点,选取1年2年3年
               iid=TRUE)

ROC   #查看模型变量信息
## Time-dependent-Roc curve estimated using IPCW  (n=297, without competing risks).
##     Cases Survivors Censored AUC (%)   se
## t=1    57       203       37   71.02 3.68
## t=2    66       106      125   69.23 3.94
## t=3    68        74      155   65.53 4.85
##
## Method used for estimating IPCW:marginal
##
## Total computation time : 0.07  secs.
结果中给出了时间点在1年、2年、3年是的AUC值以及标准误(se)
然后我们就可以根据这个结果绘制ROC曲线了。
# 第1年的
plot(ROC,
     time=1, col="red", lwd=2, title = "")   #time是时间点,col是线条颜色
# 第2年的
plot(ROC,
     time=2, col="blue", add=TRUE, lwd=2)    #add指是否添加在上一张图中
# 第3年的
plot(ROC,
     time=3, col="orange", add=TRUE, lwd=2)

#添加图例信息
legend("bottomright",
       c(paste0("AUC at 1 year: ",round(ROC[["AUC"]][1],2)),
         paste0("AUC at 2 year: ",round(ROC[["AUC"]][2],2)),
         paste0("AUC at 3 year: ",round(ROC[["AUC"]][3],2))),
       col=c("red", "blue", "orange"),
lty=1, lwd=2,bty = "n") 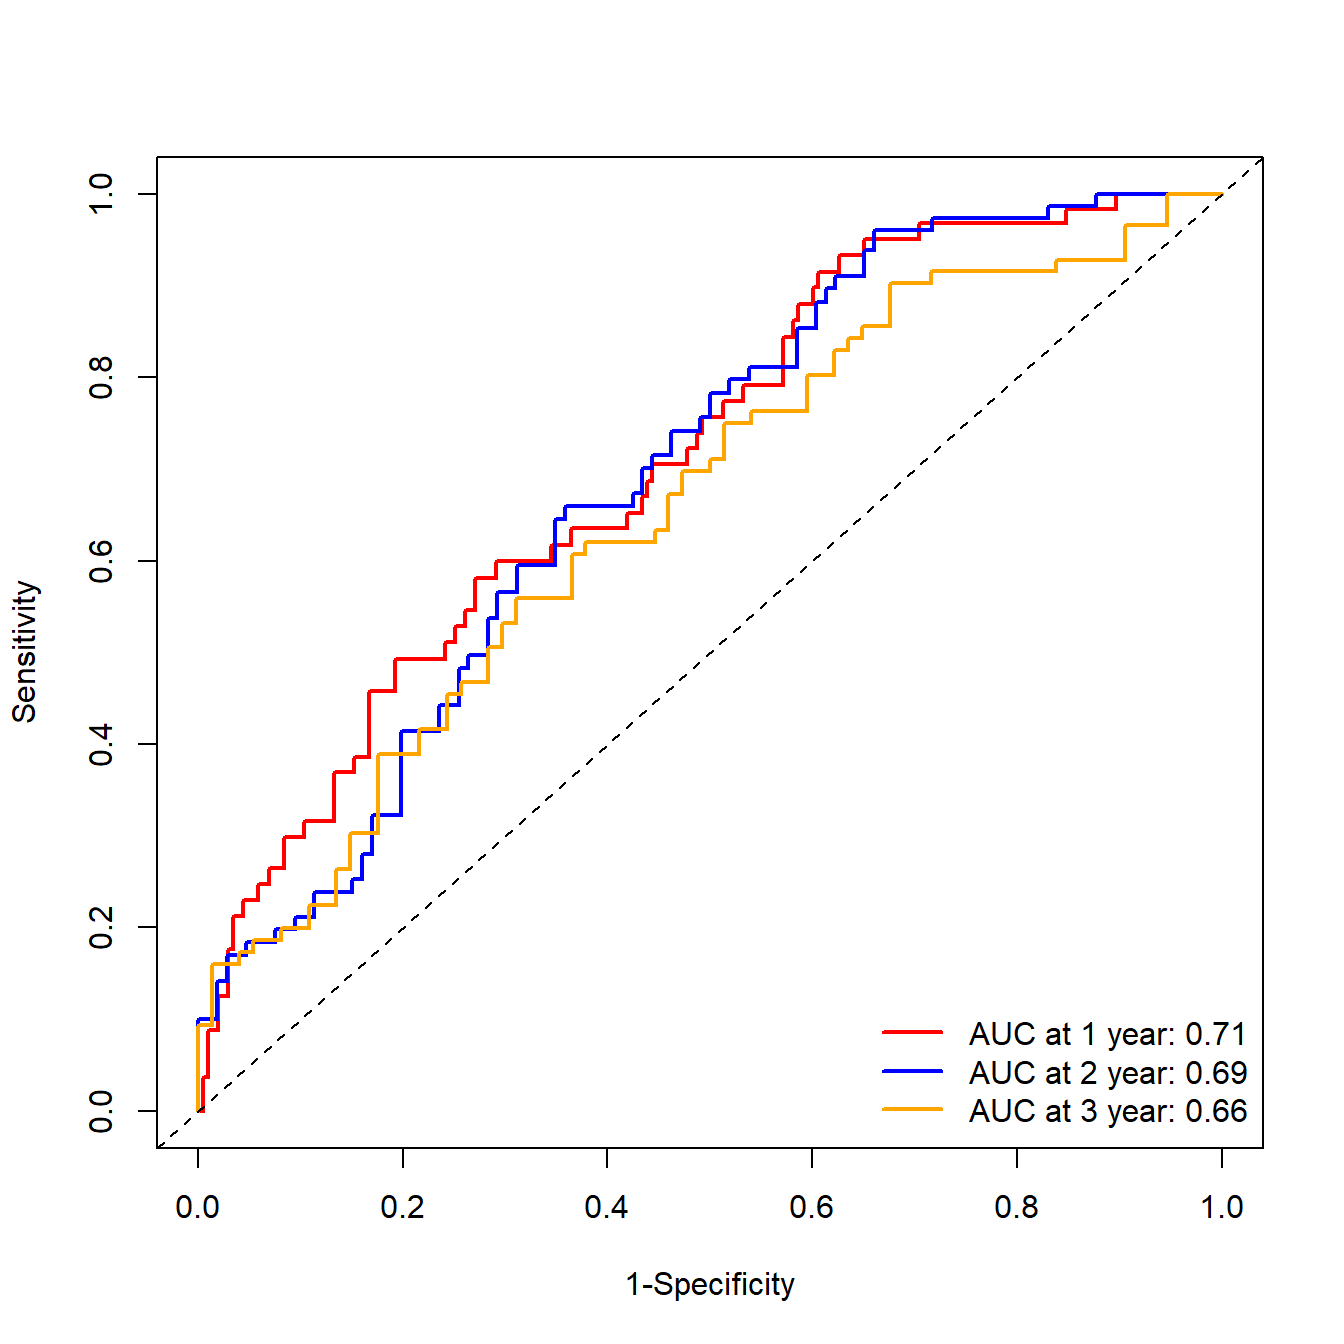
如果你想绘制其他时间点的AUC以及ROC曲线,只需要在timeROC()函数中更改时间点即可。
由于我们使用了不同的时间点,每一个时间点都有一个AUC值,所以我们可以很简单的就画出time-dependent-AUC曲线:
plotAUCcurve(ROC, conf.int = T, col = "firebrick")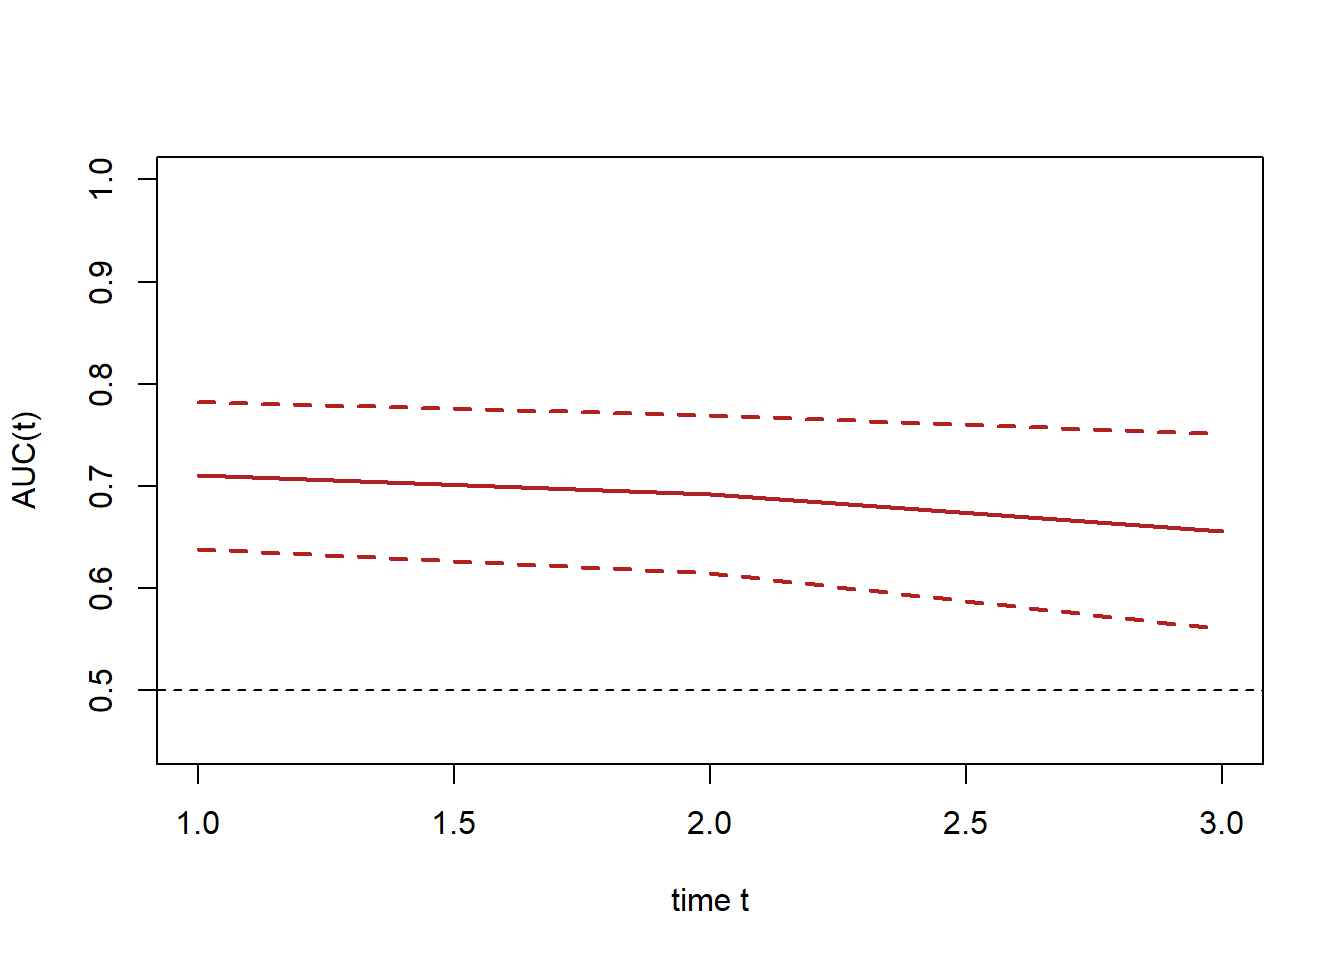
22.3 多指标ROC
大家在文献中也可能见到过多个指标的ROC曲线绘制在一张图上。下面给大家演示。
首先也是看一下所需要的数据结构,其中futime和event是必须的,另外的几列是你想要用来画ROC曲线的指标,在这里我使用了riskScore,gender,age,TNM分期。
在gender这一列,1是female,2是male,t,n,m这3列,数字代表不同的分期。
str(df2)
## 'data.frame':    297 obs. of  8 variables:
##  $ event    : num  0 0 1 0 0 1 0 0 0 0 ...
##  $ age      : int  59 63 65 73 59 66 56 42 61 48 ...
##  $ riskScore: num  -0.249 -0.511 -0.211 -0.427 0.279 ...
##  $ futime   : num  3.03 1.16 1.82 1.52 1.34 ...
##  $ gender   : num  2 2 2 1 2 2 1 2 2 2 ...
##  $ t        : num  4 4 4 3 3 3 5 3 NA 4 ...
##  $ n        : num  1 5 1 1 1 1 3 1 NA 1 ...
##  $ m        : num  1 1 1 1 1 3 1 1 3 3 ...
多指标的ROC曲线非常简单,就是构建多个ROC,依次添加即可,时间点我们统一选择3年:
# riskScore的ROC曲线
ROC.risk <- timeROC(T=df2$futime,
                    delta=df2$event,
                    marker=df2$riskScore,
                    cause=1,
                    weighting="marginal",
                    times=3,
                    iid=TRUE)

# gender的ROC曲线
ROC.gender <- timeROC(T=df2$futime,
                      delta=df2$event,
                      marker=df2$gender,
                      cause=1,
                      weighting="marginal",
                      times=3,
                      iid=TRUE)

# age的ROC曲线
ROC.age <- timeROC(T=df2$futime,
                   delta=df2$event,
                   marker=df2$age,
                   cause=1,
                   weighting="marginal",
                   times=3,
                   iid=TRUE)

# T分期的ROC曲线
ROC.T <- timeROC(T=df2$futime,
                 delta=df2$event,
                 marker=df2$t,
                 cause=1,
                 weighting="marginal",
                 times=3,
                 iid=TRUE)

# N分期的ROC曲线
ROC.N <- timeROC(T=df2$futime,
                 delta=df2$event,
                 marker=df2$n,
                 cause=1,
                 weighting="marginal",
                 times=3,
                 iid=TRUE)

# M分期的ROC曲线
ROC.M <- timeROC(T=df2$futime,
                 delta=df2$event,
                 marker=df2$m,
                 cause=1,
                 weighting="marginal",
                 times=3,
                 iid=TRUE)
把每个曲线拼在一起即可,添加一个图例:
plot(ROC.risk, time = 3, col="#E41A1C", lwd=2, title = "")
plot(ROC.gender, time = 3, col="#A65628", lwd=2, add = T)
plot(ROC.age, time = 3, col="#4DAF4A", lwd=2, add = T)
plot(ROC.T, time = 3, col="#377EB8", lwd=2, add = T)
plot(ROC.N, time = 3, col="#984EA3", lwd=2, add = T)
plot(ROC.M, time = 3, col="#FFFF33", lwd=2, add = T)
legend("bottomright",
       c(paste0("Risk score: ",round(ROC.risk[["AUC"]][2],2)),
         paste0("gender: ",round(ROC.gender[["AUC"]][2],2)),
         paste0("age: ",round(ROC.age[["AUC"]][2],2)),
         paste0("T: ",round(ROC.T[["AUC"]][2],2)),
         paste0("N: ",round(ROC.N[["AUC"]][2],2)),
         paste0("M: ",round(ROC.M[["AUC"]][2],2))
         ),
       col=c("#E41A1C", "#A65628", "#4DAF4A","#377EB8","#984EA3","#FFFF33"),
lty=1, lwd=2,bty = "n") 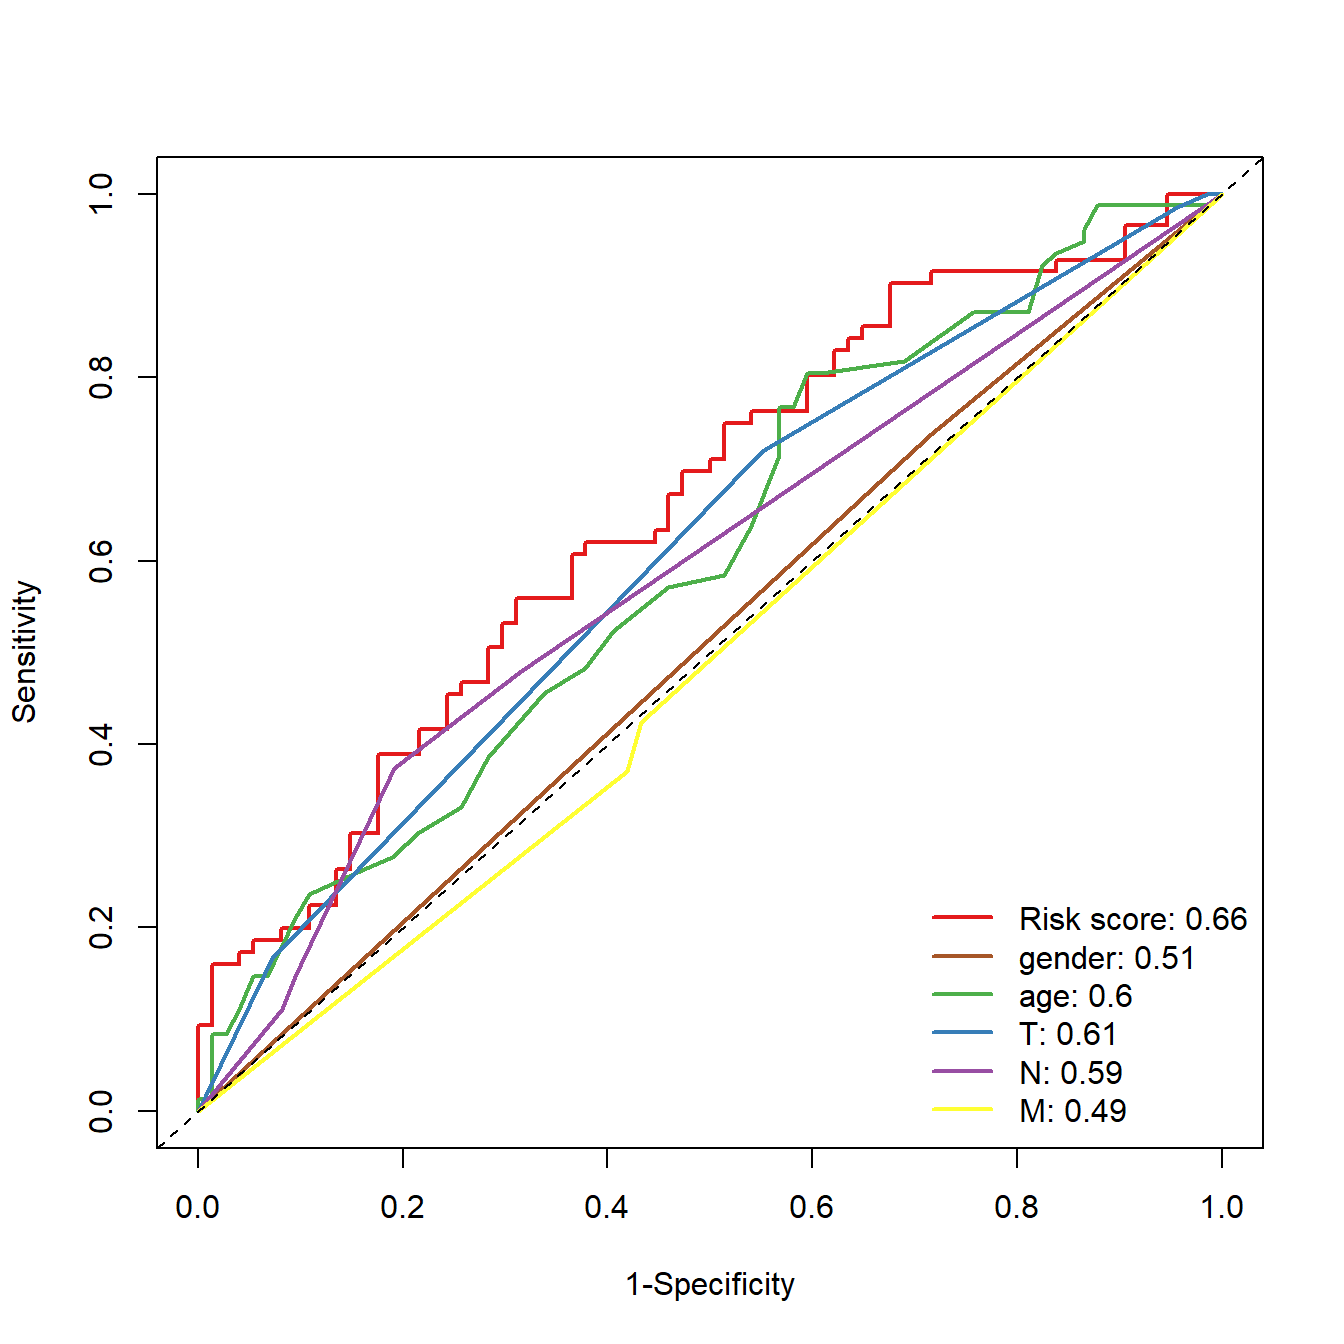
22.4 推荐阅读
ROC曲线的其他问题可参考以下推文:
- 多时间点和多指标的ROC曲线
- 临床预测模型之二分类资料ROC曲线的绘制
- 临床预测模型之生存资料ROC曲线的绘制
- ROC曲线(AUC)的显著性检验
- 生存资料ROC曲线的最佳截点和平滑曲线
- ROC曲线纯手工绘制
- R语言计算AUC(ROC曲线)的注意事项
- ROC阴性结果还是阳性结果
- 多指标联合诊断的ROC曲线
- ROC曲线最佳截点
- bootstrap ROC/AUC
- R语言多分类ROC曲线绘制
公众号后台回复ROC即可获取以上合集链接。